> ## Documentation Index
> Fetch the complete documentation index at: https://docs.parea.ai/llms.txt
> Use this file to discover all available pages before exploring further.
# Overview
Parea's observability features help developers identify and fix code or LLM-related issues.
From input/output tracking to LLM performance monitoring, Parea provides code-level observability that makes
it easy to diagnose issues and quickly iterate on failure cases.
### What Can Observability Help With?
#### Error Monitoring
* Trace logs will capture raised errors in your application.
* Dig into any trace to understand the steps that lead to the error.
#### Performance Monitoring
* Capture inputs/outputs to your LLMs to understand model behavior.
* Track evaluation scores or user feedback scores.
* Track and measure token counts, cost, and latency per request.
### Dashboard
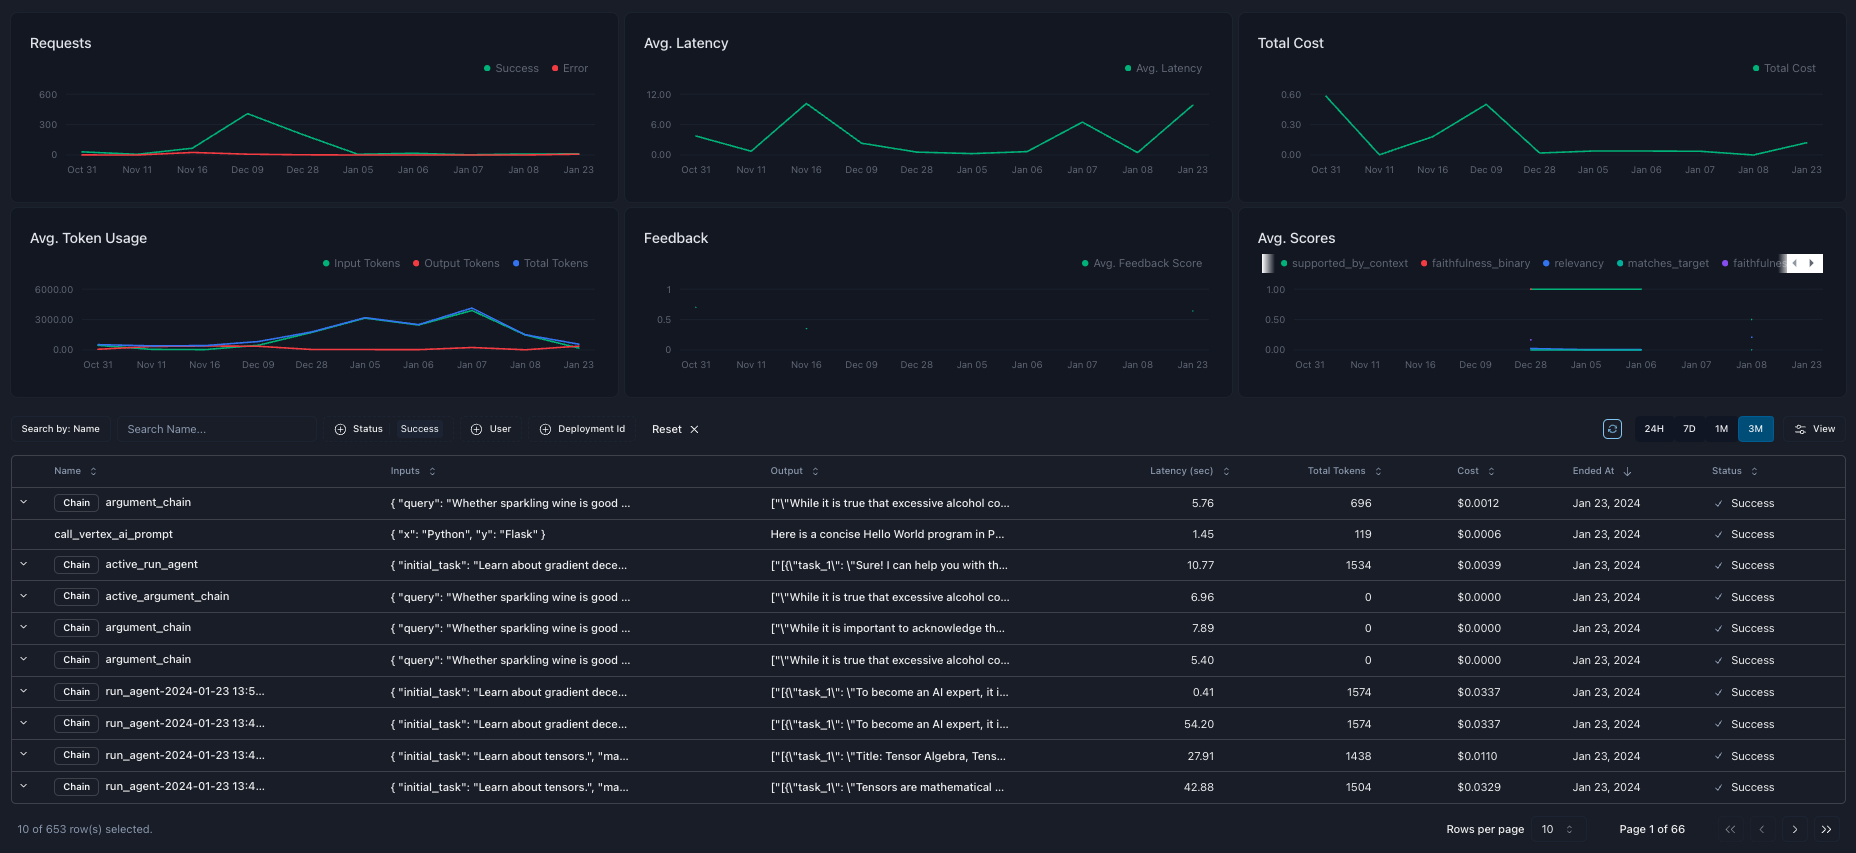
Parea's dashboard provides a high-level overview of your log data.
At the top of the dashboard, you can see aggregated metrics such as the number of requests over time,
average latency, time to first token (TTFT), total cost, average number of tokens, average user feedback scores, and average evaluation scores.
At the bottom of the dashboard is a table of your logs supporting search and filtering.
 ### Trace Details
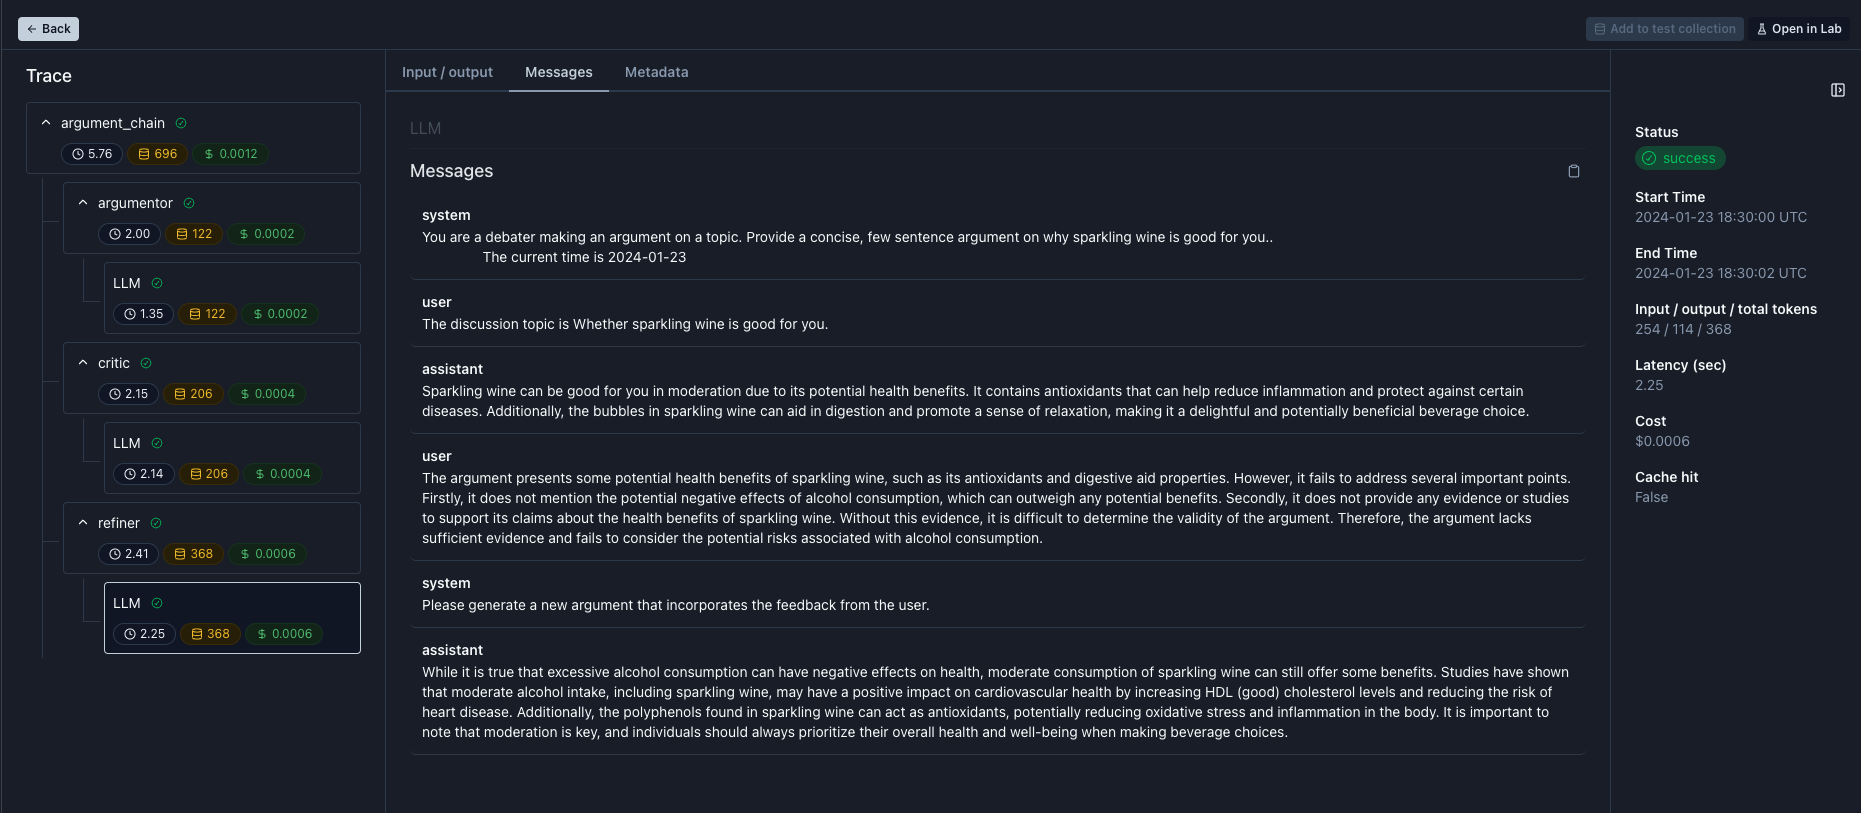
Click any row on the dashboard table to drill down into the trace and view all the critical data and associated metrics.
You can view the inputs and outputs of any traced function. You can view all the messages sent to the LLM, the model
parameters, and any custom metadata you provided. When used, function calls will also be visible on the trace tabs.
You can see a summary of the timestamps, cache hit status, cost, latency, time to first token, tokens, and any evaluation or feedback scores on the sidebar.
Observability alone is just one aspect of improving your application. To iterate further, you can quickly build test case
datasets from trace logs or open specific spans in the prompt playground.
### Trace Details
Click any row on the dashboard table to drill down into the trace and view all the critical data and associated metrics.
You can view the inputs and outputs of any traced function. You can view all the messages sent to the LLM, the model
parameters, and any custom metadata you provided. When used, function calls will also be visible on the trace tabs.
You can see a summary of the timestamps, cache hit status, cost, latency, time to first token, tokens, and any evaluation or feedback scores on the sidebar.
Observability alone is just one aspect of improving your application. To iterate further, you can quickly build test case
datasets from trace logs or open specific spans in the prompt playground.
 ### How to get started
Get started with observability
Enrich traces with metadata
### How to get started
Get started with observability
Enrich traces with metadata