Manual Review
Annotate & comment on logs.
Although Parea helps you to automatically evaluate AI software, human review is a critical part of the process. For that Parea supports annotating & commenting on trace logs. With that you can e.g. annotate logs from experiments to get feedback from subject-matter experts, or you can comment on logs to discuss them with your team.

Manual Annotation
You can enable manual annotation by clicking on the Annotate button on the top right of the trace log viewer.
The scores from the manual annotation will be aggregated in the detailed experiment view or logs dashboard depending on if the log is associated with an experiment or not.
Setting up Annotations
You set up your chosen annotation by clicking on the Edit button next to the Annotations section in the sidebar.
In the popover, you can either search for an existing annotation with the search bar or create a new one by clicking on the Add button.
Parea enables you to define continuous and categorical annotations.
While continuous annotations require you to define a minimum and maximum value, categorical annotations require you to define a list of possible labels with associated scores.
Below you can see how a categorical annotation criteria is created.

Annotate
To annotate a log, you can simply type in the score in the input field or select a label from the dropdown.
This will automatically save the annotation and update the aggregated scores of the experiments or logs dashboard.
You can unset an annotation by clicking on the X button next to it.

Commenting on Logs
To collaborate with your team, you can add comments to logs. This is useful to get more qualitative insights from your team members, and to discuss the logs in more detail.

Annotation Queue
Annotation queues are a user-friendly way to quickly cycle through and annotate multiple data.
You can send logs to the annotation queue from the logs table or detailed trace log view, from the experiment detailed logs, or the deployed prompt detailed logs.
When viewing any logs table you can select multiple logs from any log table and click the “Send to Annotation Queue” button to send them to the queue, or

Or you can click the … button on a single log and select “Annotation queue.”

When viewing a detailed trace log, you can click the “Send to Annotation Queue” button then select an existing queue or create a new one.

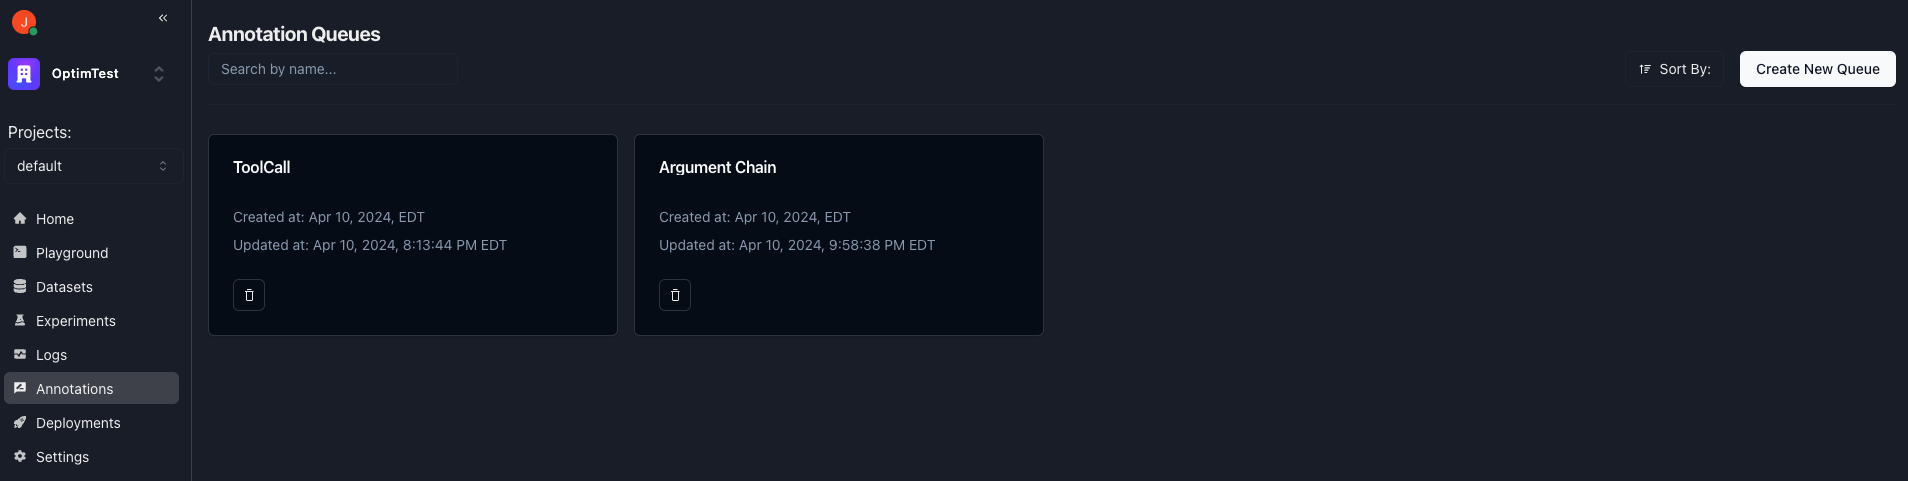
On the Annotation Queue page, you will see all of your queues. When you select a queue, you will see the inputs, outputs, and targets for logs in the queue. On the sidebar, you will be able to add/edit annotations.
You can navigate forward and backward through the queue with the navigation buttons. However, once you’re done annotating a specific log item, you can click the “Done” button.
Clicking Done will remove the log from the annotation queue and advance to the next log in the queue.

Labeling
As you navigate through the annotation queue, you can edit the inputs and output to add labeled samples to datasets. This is useful when you want to reuse the data as targets in evaluations or to fine-tune a model based on (corrected) outputs. For that you will either need to select an existing dataset or create a new one (1st screenshot). Then you can add the sample by clicking “Add to dataset” (2nd screenshot).


Labeling Function Calling / Tool Use Responses
To simplify labeling of function calling / tool use responses by subject-matter experts (SMEs), one can turn the output of the LLM into a form by clicking on “Form Mode”. Then, the SMEs can fill out/correct the respective fields in the form which has built in validation. You can then use these data to fine-tune models for data extraction or agents which rely on tool use.

Note, Form Mode is currently only available when sending LLM calls to the annotation queue. This means that you will see all the LLM inputs. You can “clean up” the queue interface by using templated LLM calls to only display the prompt template key-value pairs on the left side. See below:

Was this page helpful?