1

Installation

First, you’ll need a Parea API key. See Authentication to get started.

After you’ve followed those steps, you are ready to install the Parea SDK client.

2

Create an evaluation script

Start with creating a simple evaluation script.

import os

from dotenv import load_dotenv

from parea import Parea, trace
from parea.evals.general import levenshtein

load_dotenv()

p = Parea(api_key=os.getenv("PAREA_API_KEY"))


# annotate function with the trace decorator and pass the evaluation function(s)
@trace(eval_funcs=[levenshtein])
def greeting(name: str) -> str:
    return f"Hello {name}"

p.experiment(
    "Greetings",  # experiment name
    data=[
        { "name": "Foo", "target": "Hi Foo" },
        { "name": "Bar", "target": "Hello Bar" },
    ],  # test data to run the experiment on (list of dicts)
    func=greeting,
).run()
3

Run experiment

After you’ve followed the above steps, you are ready run your experiment.

4

View results

The executed script will create a link to the experiment overview & its traces. You will see a high-level overview of your experiment, including average values for metrics such as latencies and cost, and any evaluation functions you’ve defined. You will see a table of your logs, and any chains will be expandable. The log table supports search, filtering, and sorting.
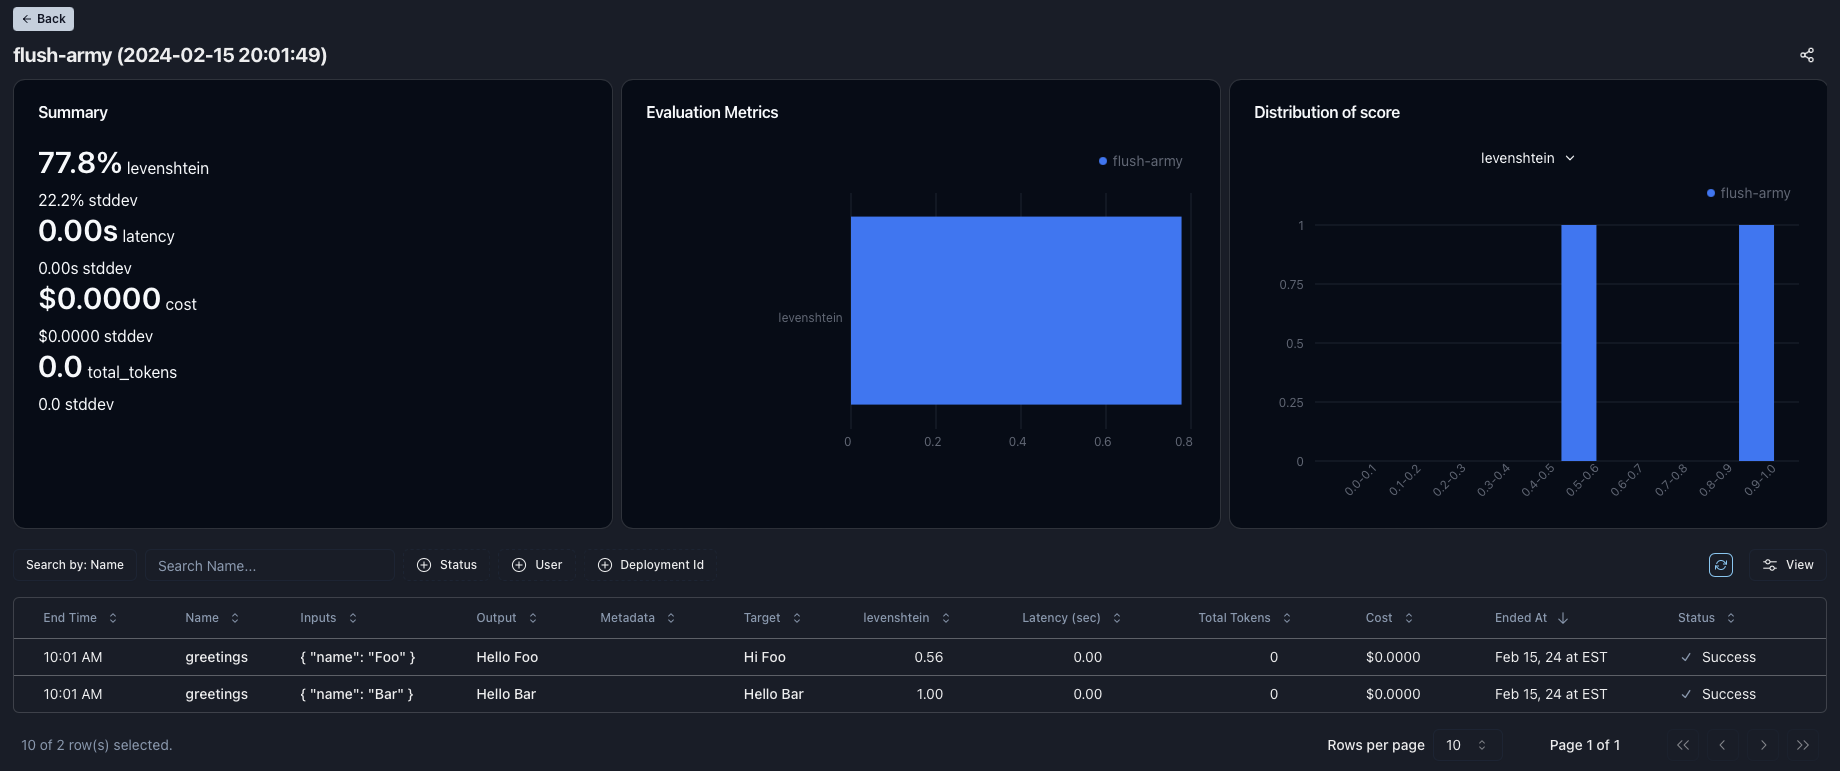
You can create additional statistics by clicking the “Pin stat” button. If you click a log, it will open the detailed trace view. Here, you can step through each span and view inputs, outputs, messages, metadata, and other key metrics associated with a given trace.

5

Can you improve to 100%?

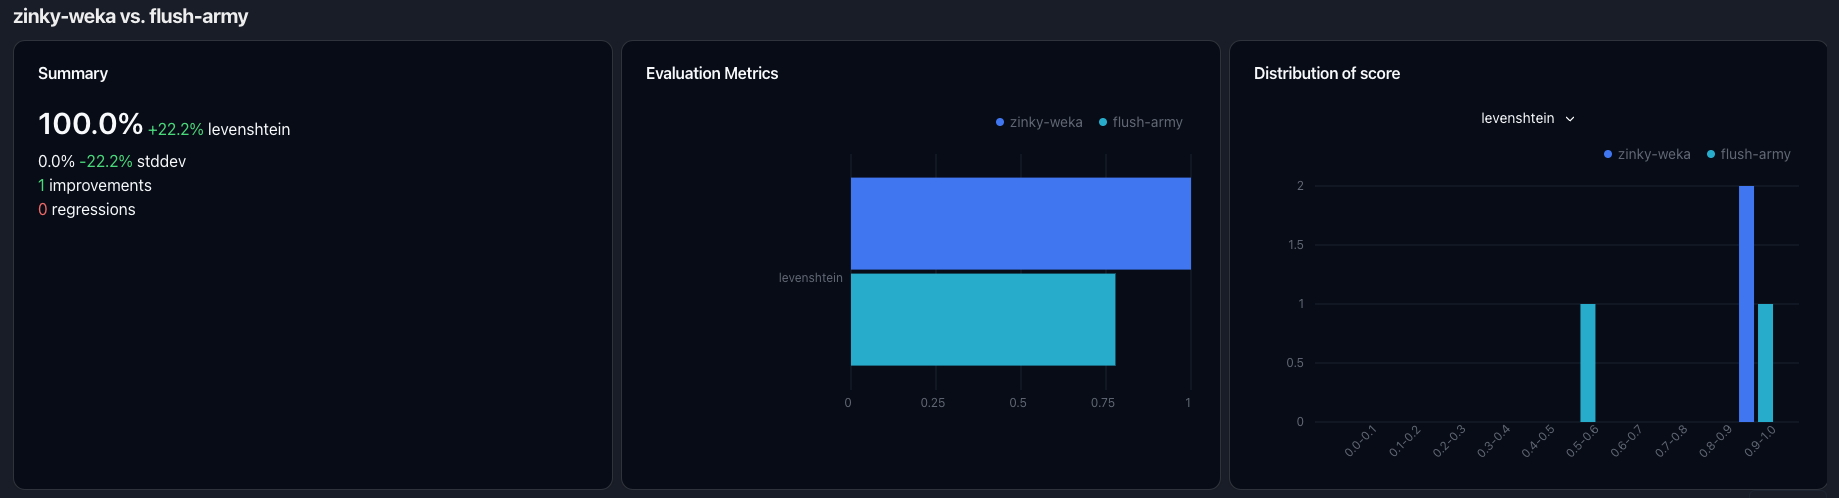
For our first experiment, we only achieved a 77.8% score. Can you improve the score to 100%? If you run another experiment, you can compare the results like the screenshot below.

What’s Next?

Dive deeper into Experiments or get started with monitoring your application.