- Composable and declarative APIs that allow developers to describe the architecture of their LLM application in the form of a “module” (inspired by PyTorch’s
nn.Module), - Optimizers formerly known as “teleprompters” that optimize a user-defined module for a particular task. The optimization could involve selecting few-shot examples, generating prompts, or fine-tuning language models.
Instrumenting DSPy Modules
To observe your DSPy application, you can usetrace_dspy to trace the execution of your DSPy modules.
Suppress Logging During Optimization / Compilation
Note, that optimization/compilation with DSPy can create a lot of logs which aren’t necessarily actionable. You can suppress these logs by using theTurnOffPareaLogging context manager.
After optimization, you will likely want to assess the performance of your module as outlined below.
Limitations
Threading & Multi-processing
The DSPy integration automatically creates nested traces by relying on Python’scontextvars.
That means, if you are using threading or multi-processing in your DSPy application, the traces of the DSPy modules in that get orphaned from the main trace.
There is an existing issue in Python’s standard library and a great explanation in the FastAPI repo that discusses this limitation.
To avoid this, you need to manually copy over the context to the new thread/process via contextvars.copy_context().
See the below example:
Threading & Multi-processing in Python
Threading & Multi-processing in Python
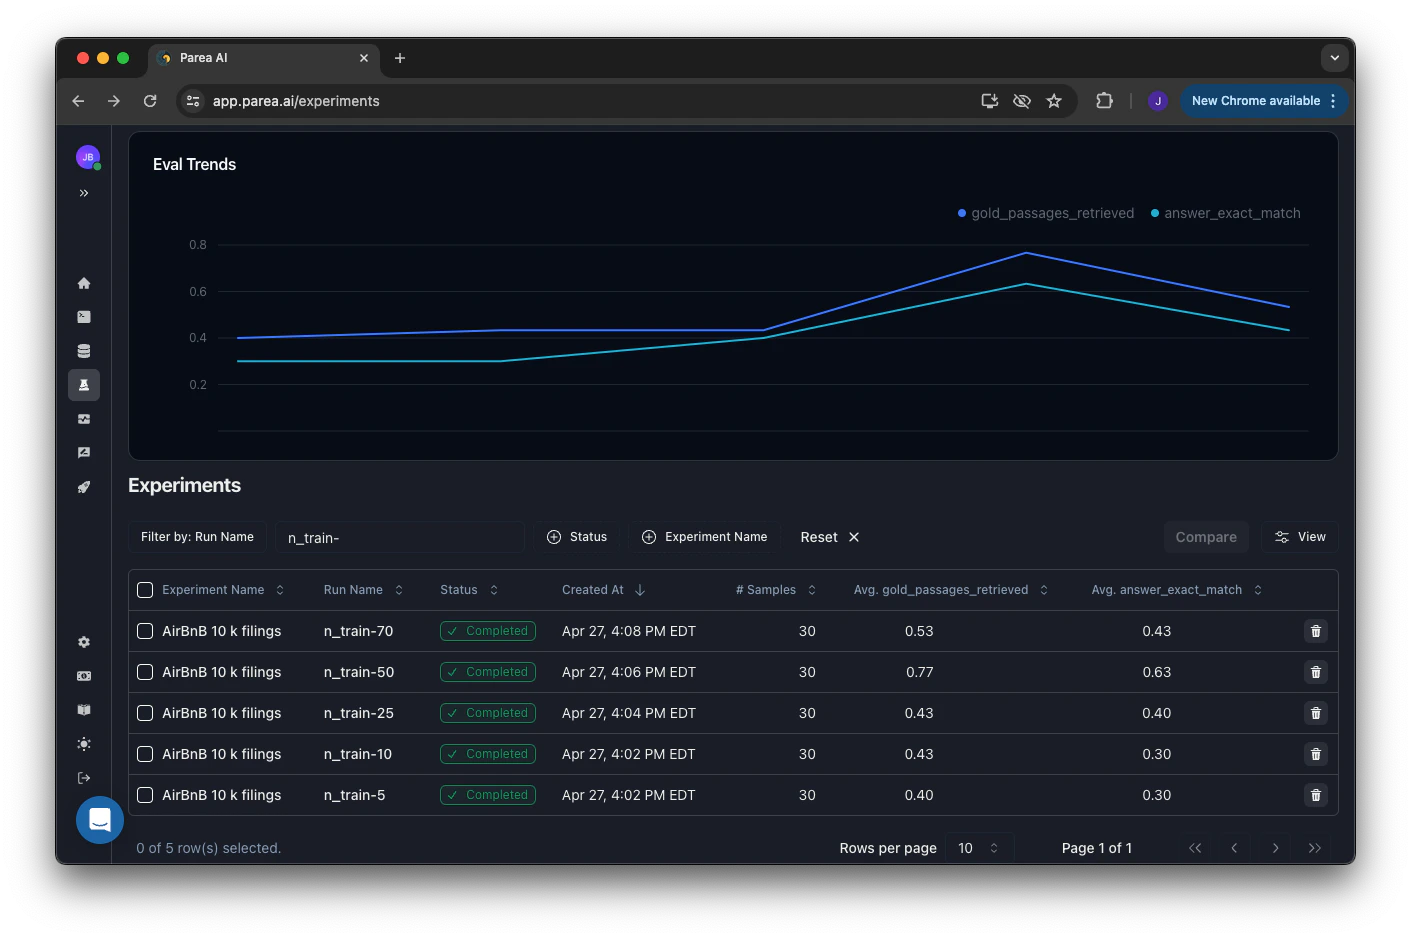
Experiment/Optimization Tracking: Evaluate DSPy Modules on a Dataset
You can evaluate & track the performance of your DSPy modules by running experiments. To evaluate DSPy modules, you need to attach the evaluation metrics to the module (attach_evals_to_module) and convert the DSPy examples to dictionaries (convert_dspy_examples_to_parea_dicts).
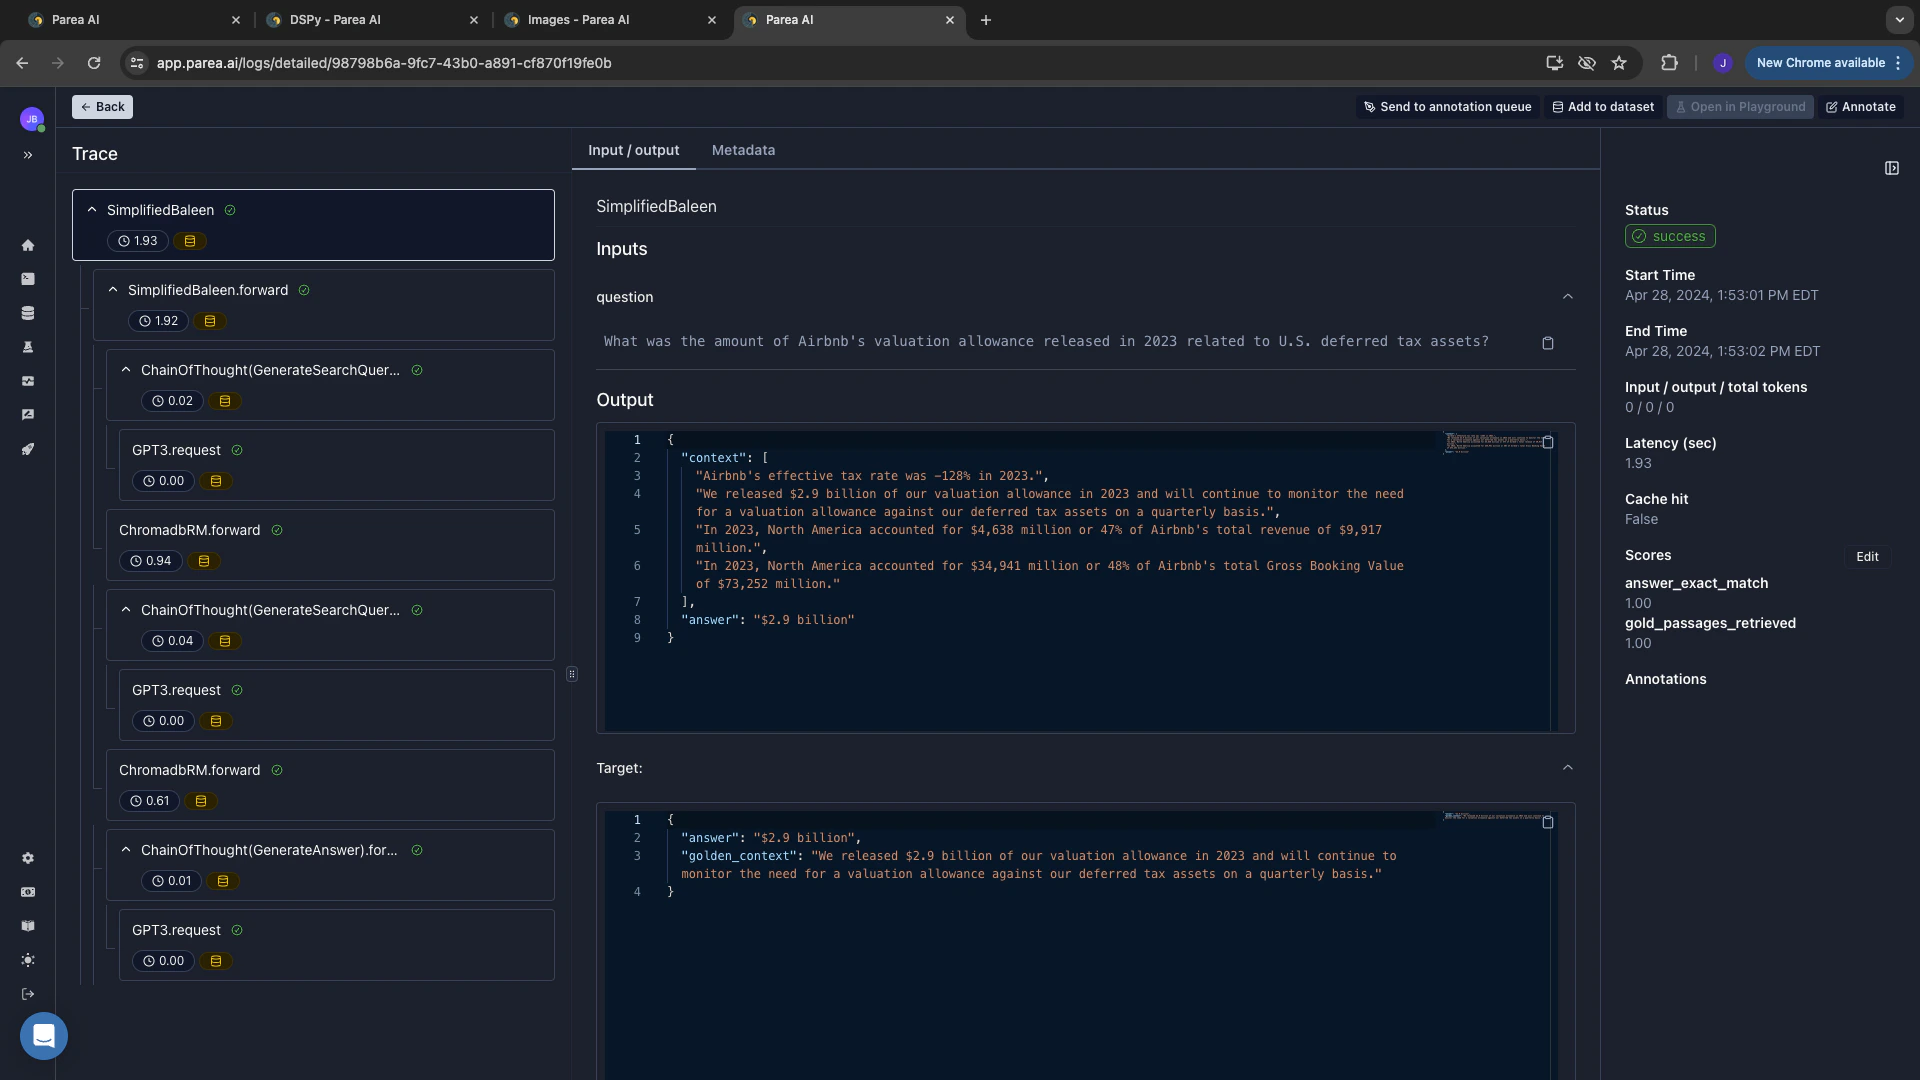
Online Evaluation: Evaluate DSPy Modules during Inference
If you have evaluation functions which don’t require reference/target answers, you can evaluate your DSPy modules by attaching those evals to the module viaattach_evals_to_module.
This will automatically apply your list of evals to the module whenever you call it. See the example below for more details.
Example: Attach Evaluation to Module
Example: Attach Evaluation to Module